


Stunning NASA City Lights: What Earth Looks Like at Night
Introduction
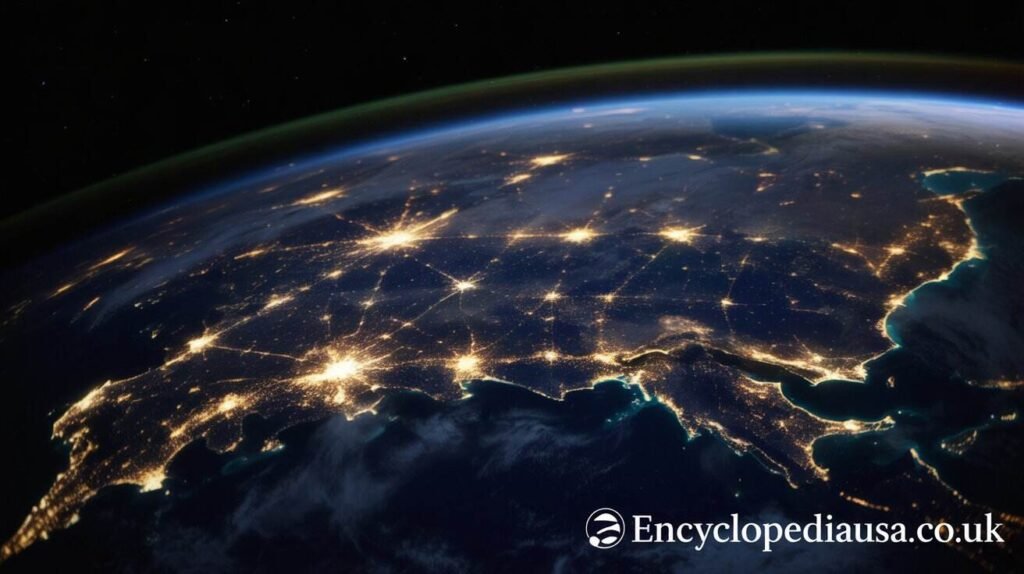
Have you ever looked up at the night sky and wondered what we look like from up there? NASA flipped that question around and gave us the answer. The NASA city lights images are some of the most breathtaking and scientifically rich photographs ever taken of our planet.
When you see Earth glowing from space at night, you are not just looking at a pretty picture. You are seeing the story of human civilization written in light. Every bright cluster represents a city. Every glowing thread is a highway or river valley packed with people. Every dark patch tells you something too, whether it is ocean, jungle, or desert.
This article walks you through everything you need to know about NASA city lights, from how these images are captured to what they reveal about our world, our energy habits, and our future. By the end, you will see the night in a completely different way.
What Are NASA City Lights Images?
NASA city lights images are composite photographs of Earth taken at night from satellites orbiting hundreds of miles above the surface. These are not single snapshots. Scientists stitch together thousands of individual images captured over months to create one seamless, cloud-free view of the entire planet glowing in the dark.
The most famous of these is called “Black Marble,” a name that perfectly captures the contrast between the deep darkness of space and the electric glow of human activity below.
The Black Marble Project
NASA released its first major city lights image in 2012 and updated it significantly in 2016 using data from the Suomi NPP satellite. The Suomi satellite carries an instrument called the Visible Infrared Imaging Radiometer Suite, or VIIRS. This sensor is extraordinarily sensitive to light, capable of detecting a single lit fishing boat on the open ocean.
The updated Black Marble images are the most detailed nighttime views of Earth ever produced. Scientists processed 312 orbits of data to create them. That is roughly nine months of nightly observations filtered through algorithms that removed moonlight, clouds, and atmospheric interference.
How NASA Captures City Lights From Space
You might wonder how a satellite photograph looks this clear at night. Daylight photography from space is straightforward because sunlight floods the scene. Nighttime is a completely different challenge.
The Technology Behind the Image
The VIIRS instrument on the Suomi NPP satellite detects light in a way that traditional cameras cannot. It captures extremely faint signals across multiple wavelengths and can distinguish between different types of light sources. This means scientists can separate city lights from wildfires, gas flares, fishing boats, and even auroras.
Here is how the process works:
- The satellite orbits Earth every 101 minutes at an altitude of about 512 miles.
- VIIRS scans the surface below and collects light intensity data pixel by pixel.
- Scientists remove data from passes where clouds, moonlight, or the sun’s glow interfered.
- Remaining data from cloud-free nights gets compiled and averaged.
- The final composite image represents months of observation merged into one glowing portrait.
The result is a picture that no single night could ever produce, but one that reflects the true, consistent pattern of human light on Earth.
What NASA City Lights Reveal About Our World
This is where things get truly fascinating. The NASA city lights images are not just beautiful. They are powerful scientific tools that researchers use to study everything from economic development to environmental impact.
Population and Urbanization Patterns
The bright clusters you see in these images match almost perfectly with major population centers. The northeastern United States glows intensely, blending Boston, New York, Philadelphia, Washington D.C., and dozens of smaller cities into one massive band of light. Western Europe shines brightly across France, Germany, the UK, and the Netherlands.
India’s Ganges Plain lights up like a river of fire, tracing one of the most densely populated stretches of land on Earth. Japan’s coastal cities form a glowing crescent around its main island of Honshu.
But the images also highlight inequality. North Korea sits in near total darkness right next to the brilliantly lit South Korea. The contrast is so stark that it has become one of the most discussed features in any NASA city lights presentation. That single visual tells you more about the difference between those two countries than paragraphs of statistics ever could.
Tracking Economic Activity
Economists and development researchers use nighttime light data as a proxy for economic output. When a region lights up over time, it usually means development is happening. When lights dim, it can signal economic contraction or population displacement.
After the 2008 financial crisis, researchers tracked dimming lights in parts of Spain and Greece. During the Syrian civil war, satellite data showed catastrophic drops in light across Syrian cities, providing early evidence of population flight and infrastructure destruction.
Energy Use and Efficiency
The NASA city lights images also reveal a great deal about how efficiently different countries and regions use energy. Older cities in the United States that still rely on high-pressure sodium streetlights glow orange. Cities that have switched to LED lighting appear whiter and cooler in tone.
Scientists can actually map LED adoption across entire countries just by analyzing the color temperature of city lights in satellite data. This kind of insight helps governments and urban planners make smarter decisions about energy infrastructure.
The Science Behind the Glow: What Different Lights Mean
Not all light in these images comes from cities. Once you know what to look for, the images become layered with meaning.
Gas Flares and Oil Fields
Some of the brightest spots in the NASA city lights images are not cities at all. The Bakken Formation in North Dakota glows almost as brightly as Minneapolis because of natural gas flaring at oil fields. Similar flares appear in Siberia, the Niger Delta, and the Persian Gulf.
Gas flaring is the practice of burning off unwanted natural gas during oil extraction. It is environmentally wasteful and economically inefficient. Researchers use satellite light data to monitor flaring rates and push for regulatory action.
Fishing Fleets
The waters around East Asia, especially near Japan, South Korea, and Taiwan, glow with clusters of light that have nothing to do with cities. These are squid fishing fleets. Fishermen use powerful lights to attract squid to the surface at night. In peak season, there can be thousands of vessels operating simultaneously, creating a ghostly constellation on the water.
Agricultural Fires
In parts of Africa and South Asia, seasonal flares of light mark the burning of agricultural fields after harvest. Farmers burn crop stubble to clear land for the next planting season. From space, this looks like temporary bright patches that appear and disappear on a seasonal cycle, completely distinct from the steady glow of city lights.
Surprising Insights From the NASA City Lights Data
Here are some of the most interesting discoveries that researchers have pulled from nighttime light satellite data:
The Nile River: Egypt is mostly dark because most of it is desert. But the Nile River valley and delta glow intensely, mapping the ancient heart of Egyptian civilization with perfect accuracy. You can literally trace the shape of one of the world’s great rivers using human settlement patterns.
The India-Pakistan Border: The border between India and Pakistan is one of the few political boundaries visible from space at night. India’s side glows with floodlights installed along the border fence, creating a line of light that cuts across the landscape like a scar.
Amazon Deforestation: As settlers clear forest in the Amazon and establish farms and towns, new lights appear in previously dark areas. Scientists track this creeping illumination to monitor deforestation rates even without direct ground observation.
Ramadan Effect: Researchers have actually detected changes in city lighting patterns in Muslim-majority countries during Ramadan. People stay up later, use more light in the evenings, and the overall nighttime luminosity of cities like Cairo and Riyadh shifts measurably during the holy month.

How NASA City Lights Help in Disaster Response
One of the most practical applications of nighttime light data is in disaster response and humanitarian assessment.
When a hurricane, earthquake, or war disrupts infrastructure, power goes out. Satellite data shows this almost immediately. After Hurricane Maria devastated Puerto Rico in 2017, NASA used nighttime light data to map the progression of power restoration across the island week by week. This gave emergency managers a bird’s-eye view of where help was still needed.
The same approach has been applied in conflict zones where access is too dangerous for ground teams. Nighttime light data can estimate how many people remain in a city, whether hospitals and critical facilities still have power, and how reconstruction is progressing.
The Environmental Debate: Too Much Light
The NASA city lights images are undeniably gorgeous, but they also document a serious environmental problem. Light pollution is growing at a rate of about 2% per year globally, according to research published in Science Advances.
Impact on Wildlife and Ecosystems
Artificial light at night disrupts the behavior of countless animal species. Sea turtle hatchlings navigate toward the ocean by moving away from the darkness of the dunes and toward the natural light of the open sea. Artificial lights from beachfront developments confuse them, causing thousands to move inland toward roads and predators each year.
Migratory birds navigate partly by starlight and moonlight. Light pollution causes millions of birds to collide with illuminated buildings during migration season. Insects, which form the base of many food chains, are drawn to and killed by artificial lights in enormous numbers.
The Human Cost of Light Pollution
Humans are not immune either. Exposure to artificial light at night suppresses melatonin production, disrupting sleep cycles. Research links chronic light pollution exposure to higher rates of certain cancers, metabolic disorders, and cardiovascular problems.
The International Dark-Sky Association estimates that one third of the world’s population can no longer see the Milky Way from where they live. That is not just a romantic loss. It represents a broken connection between humanity and the cosmos that has shaped art, religion, science, and culture for tens of thousands of years.
What the Future of NASA City Lights Research Looks Like
NASA continues to refine its nighttime imaging capabilities. The next generation of satellites will offer even higher resolution and more sophisticated spectral analysis. Researchers will be able to identify not just where lights are but precisely what kind of light source is producing them.
Machine learning is already being applied to nighttime satellite data to automate the identification of features like gas flares, fishing fleets, and newly constructed settlements. What once took teams of scientists months to analyze manually can now be processed in days.
Some researchers are combining nighttime light data with social media activity, mobile phone data, and economic indicators to build real-time models of human activity across the planet. The NASA city lights project, which started as a way to create beautiful and informative composite images, has grown into a cornerstone of global monitoring science.
Conclusion
The NASA city lights images do something remarkable. They make the invisible visible. You can see where people live, how they use energy, where economies thrive or struggle, and how human choices shape the planet, all from a single glowing portrait taken hundreds of miles above our heads.
These images are science, art, and mirror all at once. They show you a world buzzing with energy and ambition, but they also ask hard questions about light pollution, inequality, and environmental cost.
Next time you turn on a light after dark, remember that somewhere above you, a satellite might be watching. Your tiny contribution is part of a global glow that tells the story of civilization itself.
What part of the NASA city lights image surprised you most? Share your thoughts, and consider sending this article to someone who loves space, science, or just a really good photograph of our incredible planet.

Frequently Asked Questions
Q1: What is the NASA city lights image called? The most famous NASA nighttime Earth image is called the “Black Marble.” NASA first released it in 2012 and updated it in 2016 using data from the Suomi NPP satellite.
Q2: How does NASA take pictures of city lights at night? NASA uses the VIIRS instrument on the Suomi NPP satellite. It captures extremely faint light signals across multiple orbits, which scientists then compile into a single cloud-free composite image.
Q3: Why is North Korea dark in NASA city lights images? North Korea has very limited electricity infrastructure and extremely restricted energy access for most of its population. This results in almost no detectable light from space compared to its neighbors.
Q4: Can NASA city lights images show economic development? Yes. Researchers use nighttime light data as a reliable proxy for economic activity. Regions that grow brighter over time typically show signs of development, while dimming lights can indicate economic decline or population loss.
Q5: What do the orange and white lights mean in the images? Orange light typically comes from older high-pressure sodium streetlights. White or blue-white light usually indicates LED lighting. Scientists use this color difference to track LED adoption across cities and countries.
Q6: How is nighttime satellite data used in disaster response? After disasters like hurricanes or earthquakes, nighttime light data shows where power has been lost and tracks how quickly it is restored. This helps emergency managers allocate resources and monitor recovery.
Q7: Is light pollution a problem that NASA city lights images reveal? Absolutely. The images clearly show that artificial light is spreading globally at about 2% per year. This contributes to wildlife disruption, human health problems, and the disappearance of dark skies.
Q8: How often does NASA update its city lights images? NASA produces updated global nighttime composites regularly using ongoing satellite data. Daily and monthly composites are available for researchers, while major public releases happen every few years.
Q9: What are the bright lights over the ocean in NASA images? Many of those are squid fishing fleets, particularly around East Asia. Fishermen use powerful lights to attract squid. Gas flares from offshore oil platforms also appear as bright ocean points.
Q10: Can I access NASA city lights images for free? Yes. NASA makes its Black Marble and related nighttime Earth imagery freely available through its Earth Observatory and Worldview platforms for educational, research, and personal use.
Must Read Encyclopediausa.co.uk
Author Bio
James Calloway is a science and technology writer with over a decade of experience covering space exploration, earth science, and environmental research. He has contributed to publications focused on astronomy, climate science, and emerging technology. James holds a background in environmental geography and brings a passion for making complex scientific topics accessible and engaging for general audiences.